Griffith lab of
Ecology,
Evolution, and
Change
Bridging ecophysiology, evolutionary biology, biogeography, and change.
Monthly Visits
Probabilistic species co-occurrence model in R
R function cooccur() v1.2 – Now on CRAN! – Our manuscript on this package is now in press at JSS!
This R script implements the probabilistic model of species co-occurrence (Veech 2013) to a set of species distributed among a set of survey or sampling sites. The program calculates the observed and expected frequencies of co-occurrence between each pair of species. Expected frequency is based on the distribution of each species being random and independent of the other species. Program also returns the probabilities that a more extreme (either low or high) value of co-occurrence could have been obtained by chance. These probabilities can be interpreted as P-values. Look out for future updates and added functionality!
For more information on the model refer to: Veech (2013), A probabilistic model for analysing species co-occurrence, Global Ecology and Biogeography, DOI: 10.1111/j.1466-8238.2012.00789.x
For more details on the R package please see: Griffith, D.M., J.A. Veech, and C.J. Marsh. cooccur: Probabilistic Species Co-occurrence Analysis in R. J. Stat. Soft. Link to paper and the manual for the R package.
Instructions
Install the R package cooccur and load it – The development version can also be installed from GitHub.
R> install.packages("cooccur")
R> library(cooccur)
Import a sample dataset on the occurrence of Galapagos finches and run the probabilistic co-occurrence analysis. The dataset is arranged “spp_site” (row,col) with 0’s and 1’s representing absences and presences. Use a threshold “thresh=TRUE” to filter out species pairs that an not expected to co-occur more than once based on there occurrences. The dataset has species names in the data.frame row.names.
LOAD finches AND RUN cooccur
R> data(finches)

R> cooccur.finches <- cooccur(finches,
R>                           type = "spp_site",
R>                           thresh = TRUE,
R>                           spp_names = TRUE)
R> class(cooccur.finches)
The cooccur function returns a list of class “cooccur” that contains the results of the analysis. We can use the summary method to get a read of number of positive, negative, random, and classifiable species pairs.
RETURN A SUMMARY OF SIGNIFICANT RESULTS
R> summary(cooccur.finches)

Call:
cooccur(mat = finches, type = "spp_site", thresh = TRUE, spp_names = TRUE)

Cooccurrence Summary:
       Species          Sites       Positive       Negative         Random Non-random (%)
          13.0           17.0           14.0            1.0           49.0           23.4
To return a table of species pairs and their co-occurrence statistics use the “probtable()” function. The table has values for “p_lt” and “p_gt” which are the probabilities that the two species do not co-occur less or more frequently than expected.
RETURN A TABLE OF RESULTS
R> prob.table(cooccur.finches)
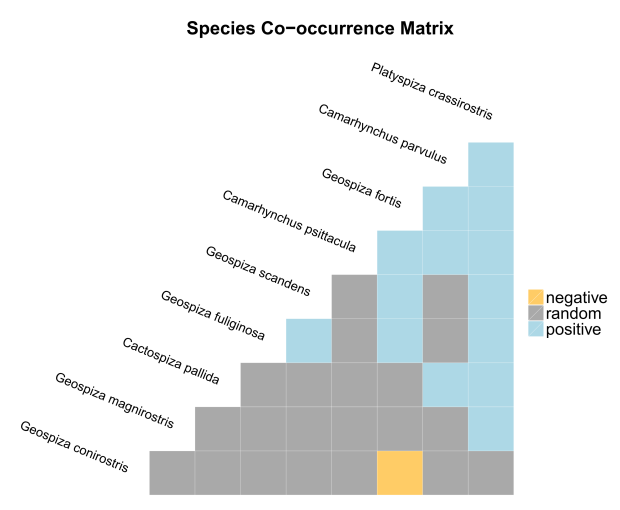
You can visually interpret these co-occurrence results using plot().
PLOT A VISUAL REPRESENTATIONS OF SPECIES CO-OCCURRENCES
R> plot(cooccur.finches) # add "plotrand = TRUE" to include completely random species
Finally, to extract information for one individual species use the following:
EXTRACT INFORMATION FOR A FOCAL SPECIES
R> pair(mod = cooccur.analysis, spp = "Geospiza scandens")

      Co-occurring Species f(Species 2) f(Cooccurrence) P(Cooccurrence) expected f(Cooccurrence)  P(low) P(high) P(Observed)
     Geospiza fuliginosa           14              13           0.630                     10.7 1.00000 0.00588     0.00588
       Geospiza scandens           12              12           0.540                      9.2 1.00000 0.00210     0.00210
    Geospiza conirostris            2               0           0.090                      1.5 0.04412 1.00000     0.04412
 Camarhynchus psittacula           10              10           0.450                      7.6 1.00000 0.01471     0.01471
   Camarhynchus parvulus           10              10           0.450                      7.6 1.00000 0.01471     0.01471
Platyspiza crassirostris           11              11           0.495                      8.4 1.00000 0.00630     0.00630
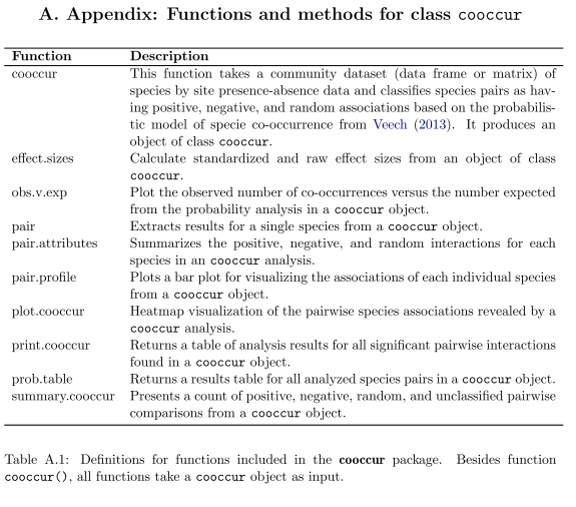
This is a basic tutorial of the use of the cooccur package. There is further documentation to come, but for now the other analysis and visualization functions included in the package are summarized in the table below and their usage defined in the manual.